.jpg)
Report
Impact of Technogenic Risk on CRQ
January 28, 2025
Supply chain attacks, which target a third-party software dependency, hardware component, or service provider within a specific technology’s value chain, have risen in both prevalence and severity over the past few years. The 2023 MOVEit incident, for instance, impacted thousands of organizations and has been estimated to cost upwards of $12.25 billion, which, if correct, makes it one of the top 5 most expensive cyber attacks in history.
Indeed, these types of attacks can be especially insidious as they are often hidden from the technology’s users, difficult to track, and nearly impossible to contain. This catastrophic nature underscores the critical need to establish proactive, data-driven management approaches that specifically address technology-driven cybersecurity risks, minimizing both the likelihood of occurrence and the potential severity should such an event take place.
However, with the number of known vulnerabilities growing by roughly 20,000 on an annual basis since 2021, the rising adoption of cloud and SaaS solutions, and the increasing trend of organizations using a third-party service provider to manage devices and servers, patching all vulnerabilities within a technologically diverse environment is an insurmountable task. The solution for cybersecurity teams, instead, is to develop a prioritization strategy for vulnerability mitigation that will not only maximize risk reduction per unit effort but also align with business goals by focusing on the vulnerabilities that are most likely to be exploited by threat actors in the wild and cause material financial harm.
Kovrr’s Technogenic Vulnerability Modeling Methodology
Within cyber risk quantification (CRQ), we need to move beyond simply ranking currently reported vulnerabilities. A risk forecast typically covers a period from today to 12 months, over which time new vulnerabilities will be identified and reported, with a range of severities (under CVSS and EPSS).
We, therefore, produce a risk adjustment based on a forecast of the frequency and severity of future CVE occurrences. Our models can then adjust for the potential risk of individual technologies and assign numerical risk adjustments to the frequency of successful attacks originating from or propagating into said technology.
Drivers of Technology Risk
We have studied the historic CVE reports and severity indicators from CVSS and EPSS strategies and identified three main drivers that influence the risk presented by a technology or service:
- Operation: What does each technology do? For example, operating systems, network software, and hardware have a high level of attention from both adversaries and security researchers looking for weaknesses.
- Vendor: Who made it? We found a high level of consistency between vendors with multiple products, indicating that a secure coding culture and business practices are good indicators.
- Attack Surface Breadth: How wide is the attack surface? How does the risk scale as the company grows? If there is one asset with the technology, or 10,000, this has become an indicator of the IT scale. A diverse software and hardware estate is much more challenging to maintain, patch, and track than a simple one.
Operation
To look at the operation of each technology, we categorize each of the reported CVEs into product types (e.g., DB, web server) and assign product type-related risk parameters. Figure 1 below shows the relative risk presented by different operational types of technology, as calculated using CVE and EPSS scores. For this example, we have considered CVEs, which are both exploitable and are likely to allow initial access to be gained (e.g., attack surface breach).
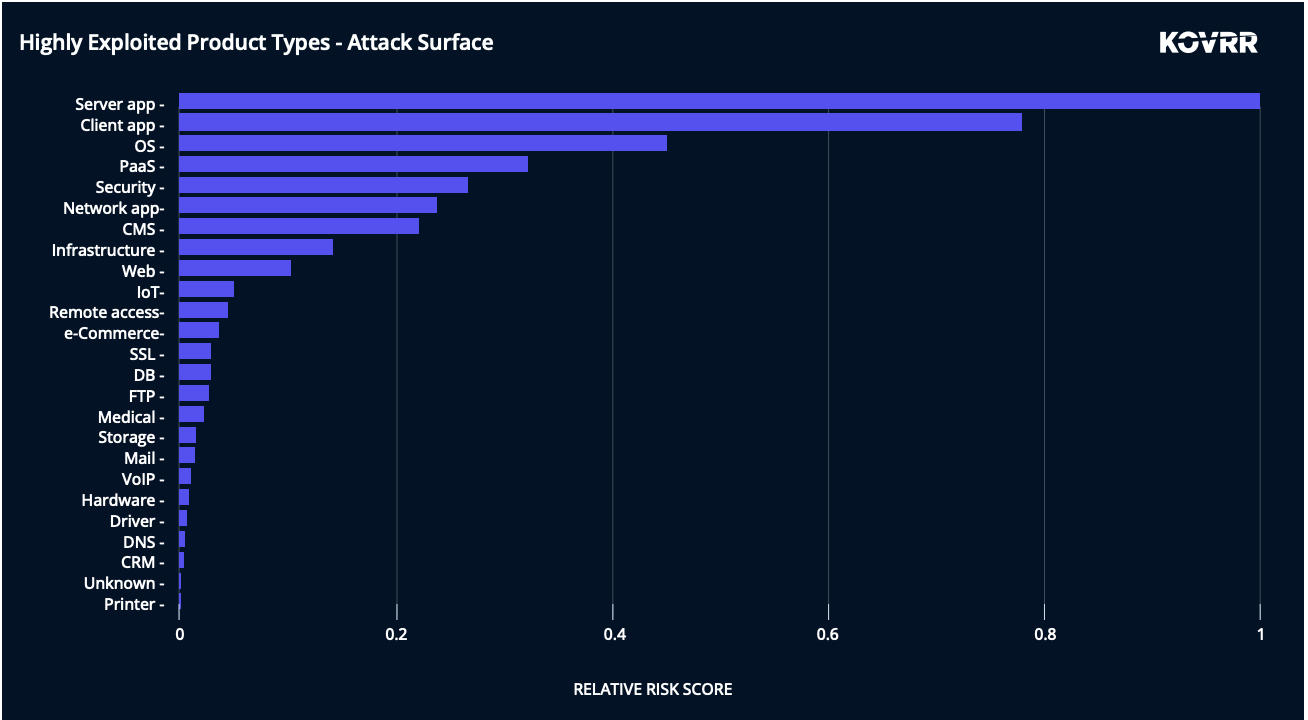
By comparing the exploitation scores in Figure 1, we can immediately conclude that exploitation risk stems primarily from certain product types within the organization, such as server applications (e.g., web servers, application-specific servers inside organizations), client applications (e.g., browsers, productivity apps), operating systems and PaaS (e.g., cloud services).
These categories are much more likely to be exploited based on past performance, and while it is unlikely to be possible to remove these from the estate, understanding where the majority of the risk is likely to occur is an important consideration.
Vendors
Similarly, we can assess the relative risk by vendor, again for vulnerabilities that allow for initial access.
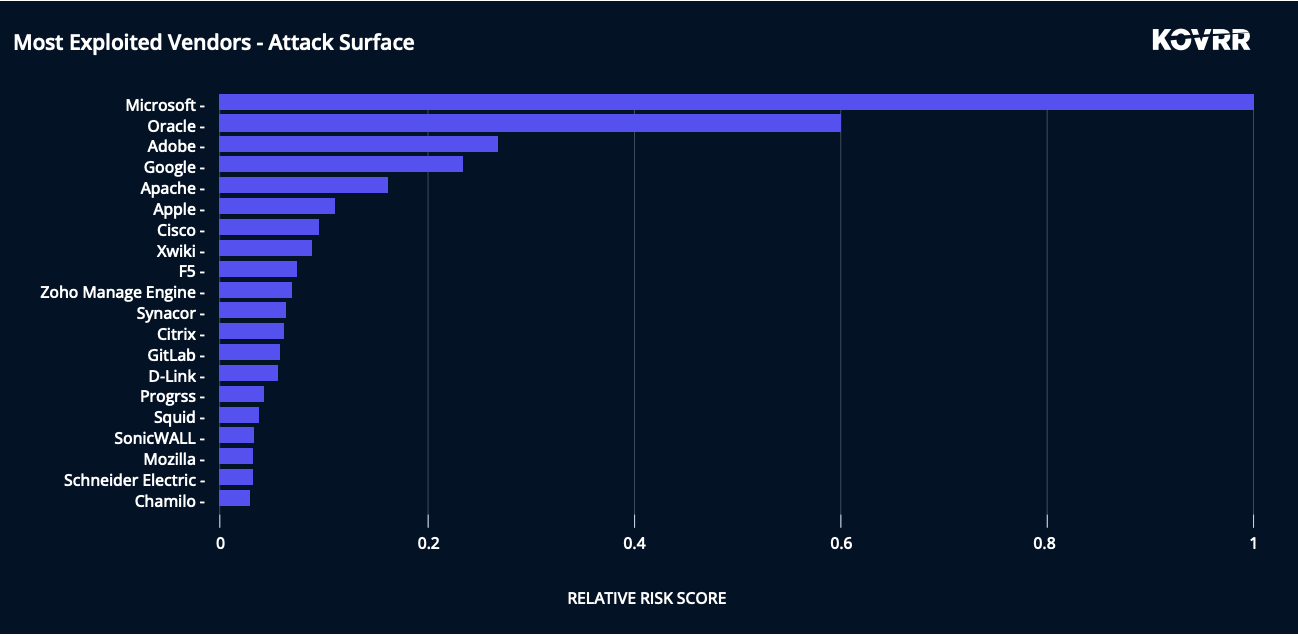
In Figure 2, the data highlights the vendors that expose organizations to the most cybersecurity risk. Microsoft and Oracle’s exploitability dominates due to their rich enterprise infrastructure ecosystems, which is highly attractive to threat actors seeking to include generic propagation exploits in their exploit kits.
Attackers find Microsoft highly attractive both as a means of initial infection by exploiting vulnerabilities in its ubiquitous client apps, such as they did with Outlook and Excel (e.g., CVE-2018-0802 Office memory corruption vulnerability). Similarly, malicious actors abused Microsoft as a means of propagating within victim organizations by harnessing wormable propagation vulnerabilities, such as the infamous CVE-2017-0145 EternalBlue vulnerability that was abused in the WannaCry ransomware variant.
For Oracle, the CVE-2012-0507 Oracle-JRE vulnerability was used by three threat actors in 66 malware variants and 42 ransomware variants, and the CVE-2019-2725 Oracle WebLogic vulnerability was exploited by four threat actors in 10 malware variants and nine ransomware variants.
Notably, Apple also exposes organizations to many critical vulnerabilities due to the high attractiveness of its iOS, iPadOS, and MacOS ecosystem, which attackers consider highly lucrative. (Bounties for zero-day vulnerabilities found in Apple operating systems are some of the highest and not for naught, given their historical use by high-profile individuals in cyber espionage cases.)
Attack Surface Breadth
The third technographic risk dimension considers the number of technologies used and the number of assets within an area of the business. The risk dimensions above are mapped to specific software definitions (by CPE identifier) across an organization's technology stack to determine the overall level of risk adjustment. Each technology contributes to the organization's overall risk, which is then transformed into an adjustment on incident frequency as part of the Monte Carlo simulation of cybersecurity events.
The overall risk of the technology stack is compared against benchmarks for industry peers to attain a relative adjustment to the residual risk frequency. Organizations that employ devices powered by more risky technologies are adjusted to experience a higher probability of breach. Conversely, organizations that utilize less risky technologies are adjusted to experience lower exposure.
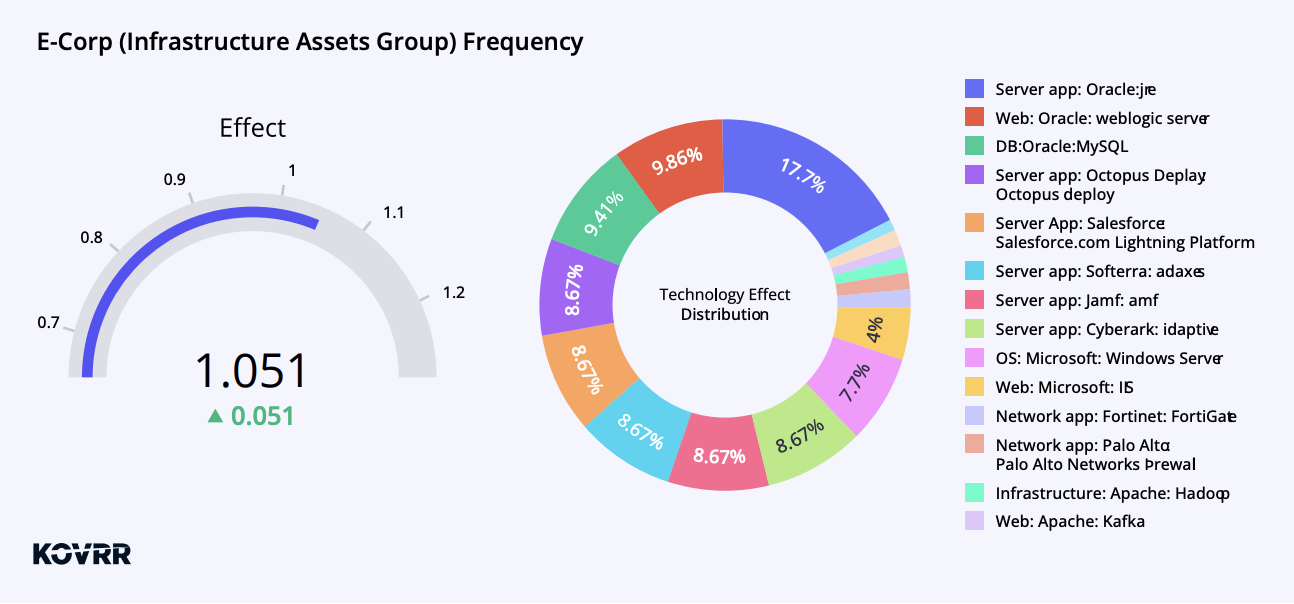
For example, Figure 3 shows Kovrr’s adjustment for E-Corp’s Infrastructure Asset Group. The gauge measuring 1.051 corresponds to a +5.1% adjustment for technology-related events compromising an organization’s infrastructure asset group. The +5.1% indicates that the asset group’s technological stack is 5.1% more risky than the benchmark technological stack of asset groups that were the initial cause of a cybersecurity attack in the wild.
The pie chart in Figure 3 illustrates the distribution of the asset group’s different technologies’ contribution to the adjustment effect (shown in the gauge). Oracle technologies are the greatest sources of vulnerabilities in this asset group, driving some 37% of the risk, with server applications provided by various vendors following close behind. Microsoft web-server technologies also pose a significant threat at roughly 12%.
An Optimized Vulnerability Prediction Methodology
The Kovrr Research Department’s innovative approach to evaluating vulnerabilities enables our models to quantify technology-driven risk at the asset group level within an organization from an elevated perspective, facilitating more informed decision-making regarding cybersecurity mitigation prioritization efforts and resource allocation.
Scoring exposure levels according to high-level categories of product type and vendor results in parameters that have a longer shelf life (i.e., data half-life). Additionally, by using a machine learning-based forecasting framework, such as EPSS, we facilitate modeling cybersecurity risk at a business level rather than at a technical level that, quite often, is divorced from actual cyber incidents in the wild.


.jpg)